
Trifecta.Systems

Make confident decisions with your own data

You already have valuable data. I can turn it into dashboards and clear visuals that help you spot trends, catch problems early, and back up the decisions you need to make.

See Example Work

What I Can Do With Your Data

If you would rather back your decisions with clear data instead of instinct alone, I can help you get there. I take the information you already have and organize it into dashboards and views that show you exactly what is happening in your business.

That typically means cleaning and organizing your data, digging into it to find what matters, and building custom visualizations that give you and your team a reliable picture. The goal is always something practical: a dashboard your team reaches for every day, not just at quarterly meetings.

Whether you need clearer customer insight, tighter internal reporting, or a focused one-off study, I build analytics solutions sized to your objectives and the data you already have.
Featured Data Visualizations

These Tableau projects demonstrate the kind of analysis and visualization I build. Your project would be tailored to your specific data and goals.

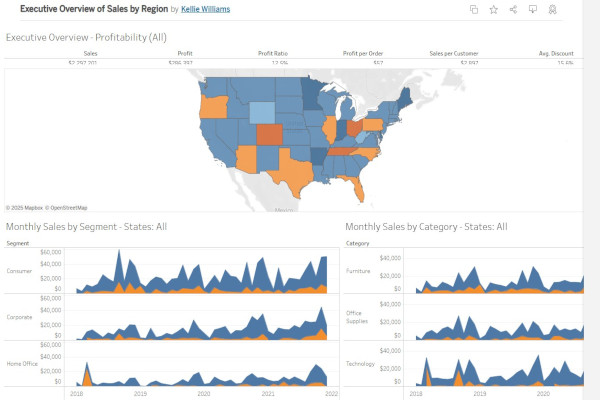
Executive Overview of Sales by Region Thumbnail

Executive Overview of Sales by Region

An interactive dashboard that lets leadership quickly see regional sales trends, product performance, and quarterly growth at a glance.

View Visualization
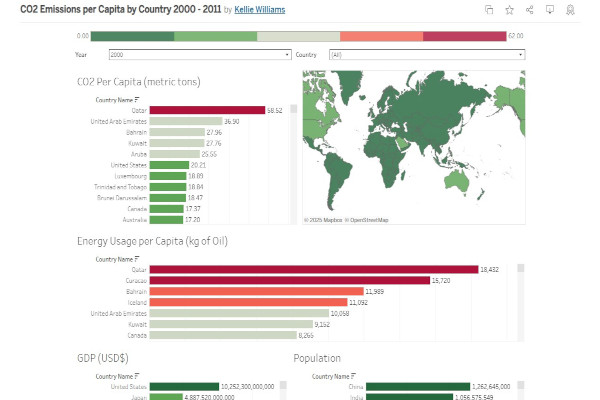
CO2 Emissions by Region

CO2 Emissions by Region

A comparative analysis showing how CO2 emissions per capita vary across regions, making complex data easy to interpret.

View Visualization
World Happiness

World Happiness Report

A multi-factor visualization connecting happiness scores to GDP, life expectancy, trust, and other measurable drivers.

View Visualization